During the July 2026 smoke outbreak, a sensor in Blaine logged 342.8 µg/m³ of fine particles, a provisional record for the Twin Cities. Wildfire smoke from the Boundary Waters and Ontario pushed the AQI Minneapolis residents check every morning into the Hazardous range, a level the state had never issued for the metro before.
So how far can you trust a forecast? On a hot ozone day, quite a bit. Once smoke is on the move, a lot less. Minnesota’s forecasters predict the air quality index up to three days ahead, and knowing where those predictions slip lets you pair them with live readings so a smoky afternoon never catches your family off guard.
TL;DR Quick Answers
AQI Minneapolis
AQI Minneapolis readings usually sit in the Good to Moderate range, but wildfire smoke can push the Twin Cities into Hazardous within a day, as it did in July 2026. Check the live AQI before outdoor plans. Once it reaches orange, 101 or higher, close the windows and run a MERV 13 filter.
Where to check: Live AQI maps and AirNow update hourly, so the current reading beats yesterday’s number.
What drives it: Fine particles from wildfire smoke and winter inversions do most of the damage. Ozone adds to it on hot, still summer afternoons.
Forecast vs. live reading: State forecasts look three days ahead. Smoke can still arrive sooner or thicker than predicted, so let the live number make the call.
Who should act first: Kids, older adults, pregnant people, and anyone with asthma or heart disease should cut back at orange. Everyone should be at red, 151 and up.
Protect your indoor air: Don’t take your indoor air for granted! Close the windows, switch the thermostat fan to “On,” and use a MERV 13 filter or the highest rating your system handles.
Top Takeaways
Forecasts look three days ahead. MPCA updates the AQI category daily for zones across the metro.
Ozone forecasts hold up best. Heat and wind are patterns weather models track well.
Smoke forecasts carry the most uncertainty. Satellite gaps can delay a plume in the model or understate how thick it gets.
Your apps disagree for a reason. Each one averages data differently, and the gaps widen when the air changes fast.
Plan with the forecast and decide with live data. Keep indoor air protected with closed windows, a running fan, and MERV 13 where your system allows it.
Who Makes the Minneapolis Air Quality Forecast?
Meteorologists at the Minnesota Pollution Control Agency (MPCA) write the forecast every day. They look three days ahead for more than a dozen locations and give the Twin Cities metro its own forecast areas. Each prediction starts with weather model data and recent monitor readings, which the team runs through a machine learning model to land on an AQI category.
Once the forecast hits orange, Unhealthy for Sensitive Groups, MPCA issues an air quality alert. You’ll see it through the National Weather Service, on MnDOT freeway signs, and in MPCA’s email notifications. The agency’s meteorologists have said they aim to get those alerts out 12 to 24 hours before the bad air shows up.
Forecast vs. Current AQI: Why Your Apps Disagree
Here’s something that might surprise you. Three apps can show three different numbers for the same neighborhood at the same moment, and every one of them can be right.
The forecast predicts the day’s overall AQI category before it happens.
The NowCast is AirNow’s current reading. It leans hard on the latest hours when pollution changes fast and evens things out when the air holds steady.
One-hour readings from some private apps move quicker, so they’re usually the first to jump when smoke rolls in.
Low-cost sensors in neighborhood networks need a correction before they match regulatory monitors.
Most days, the numbers line up closely. A smoke front can pull them apart for hours.
What Makes a Minneapolis AQI Forecast Miss?
Wildfire Smoke Is the Hardest Call
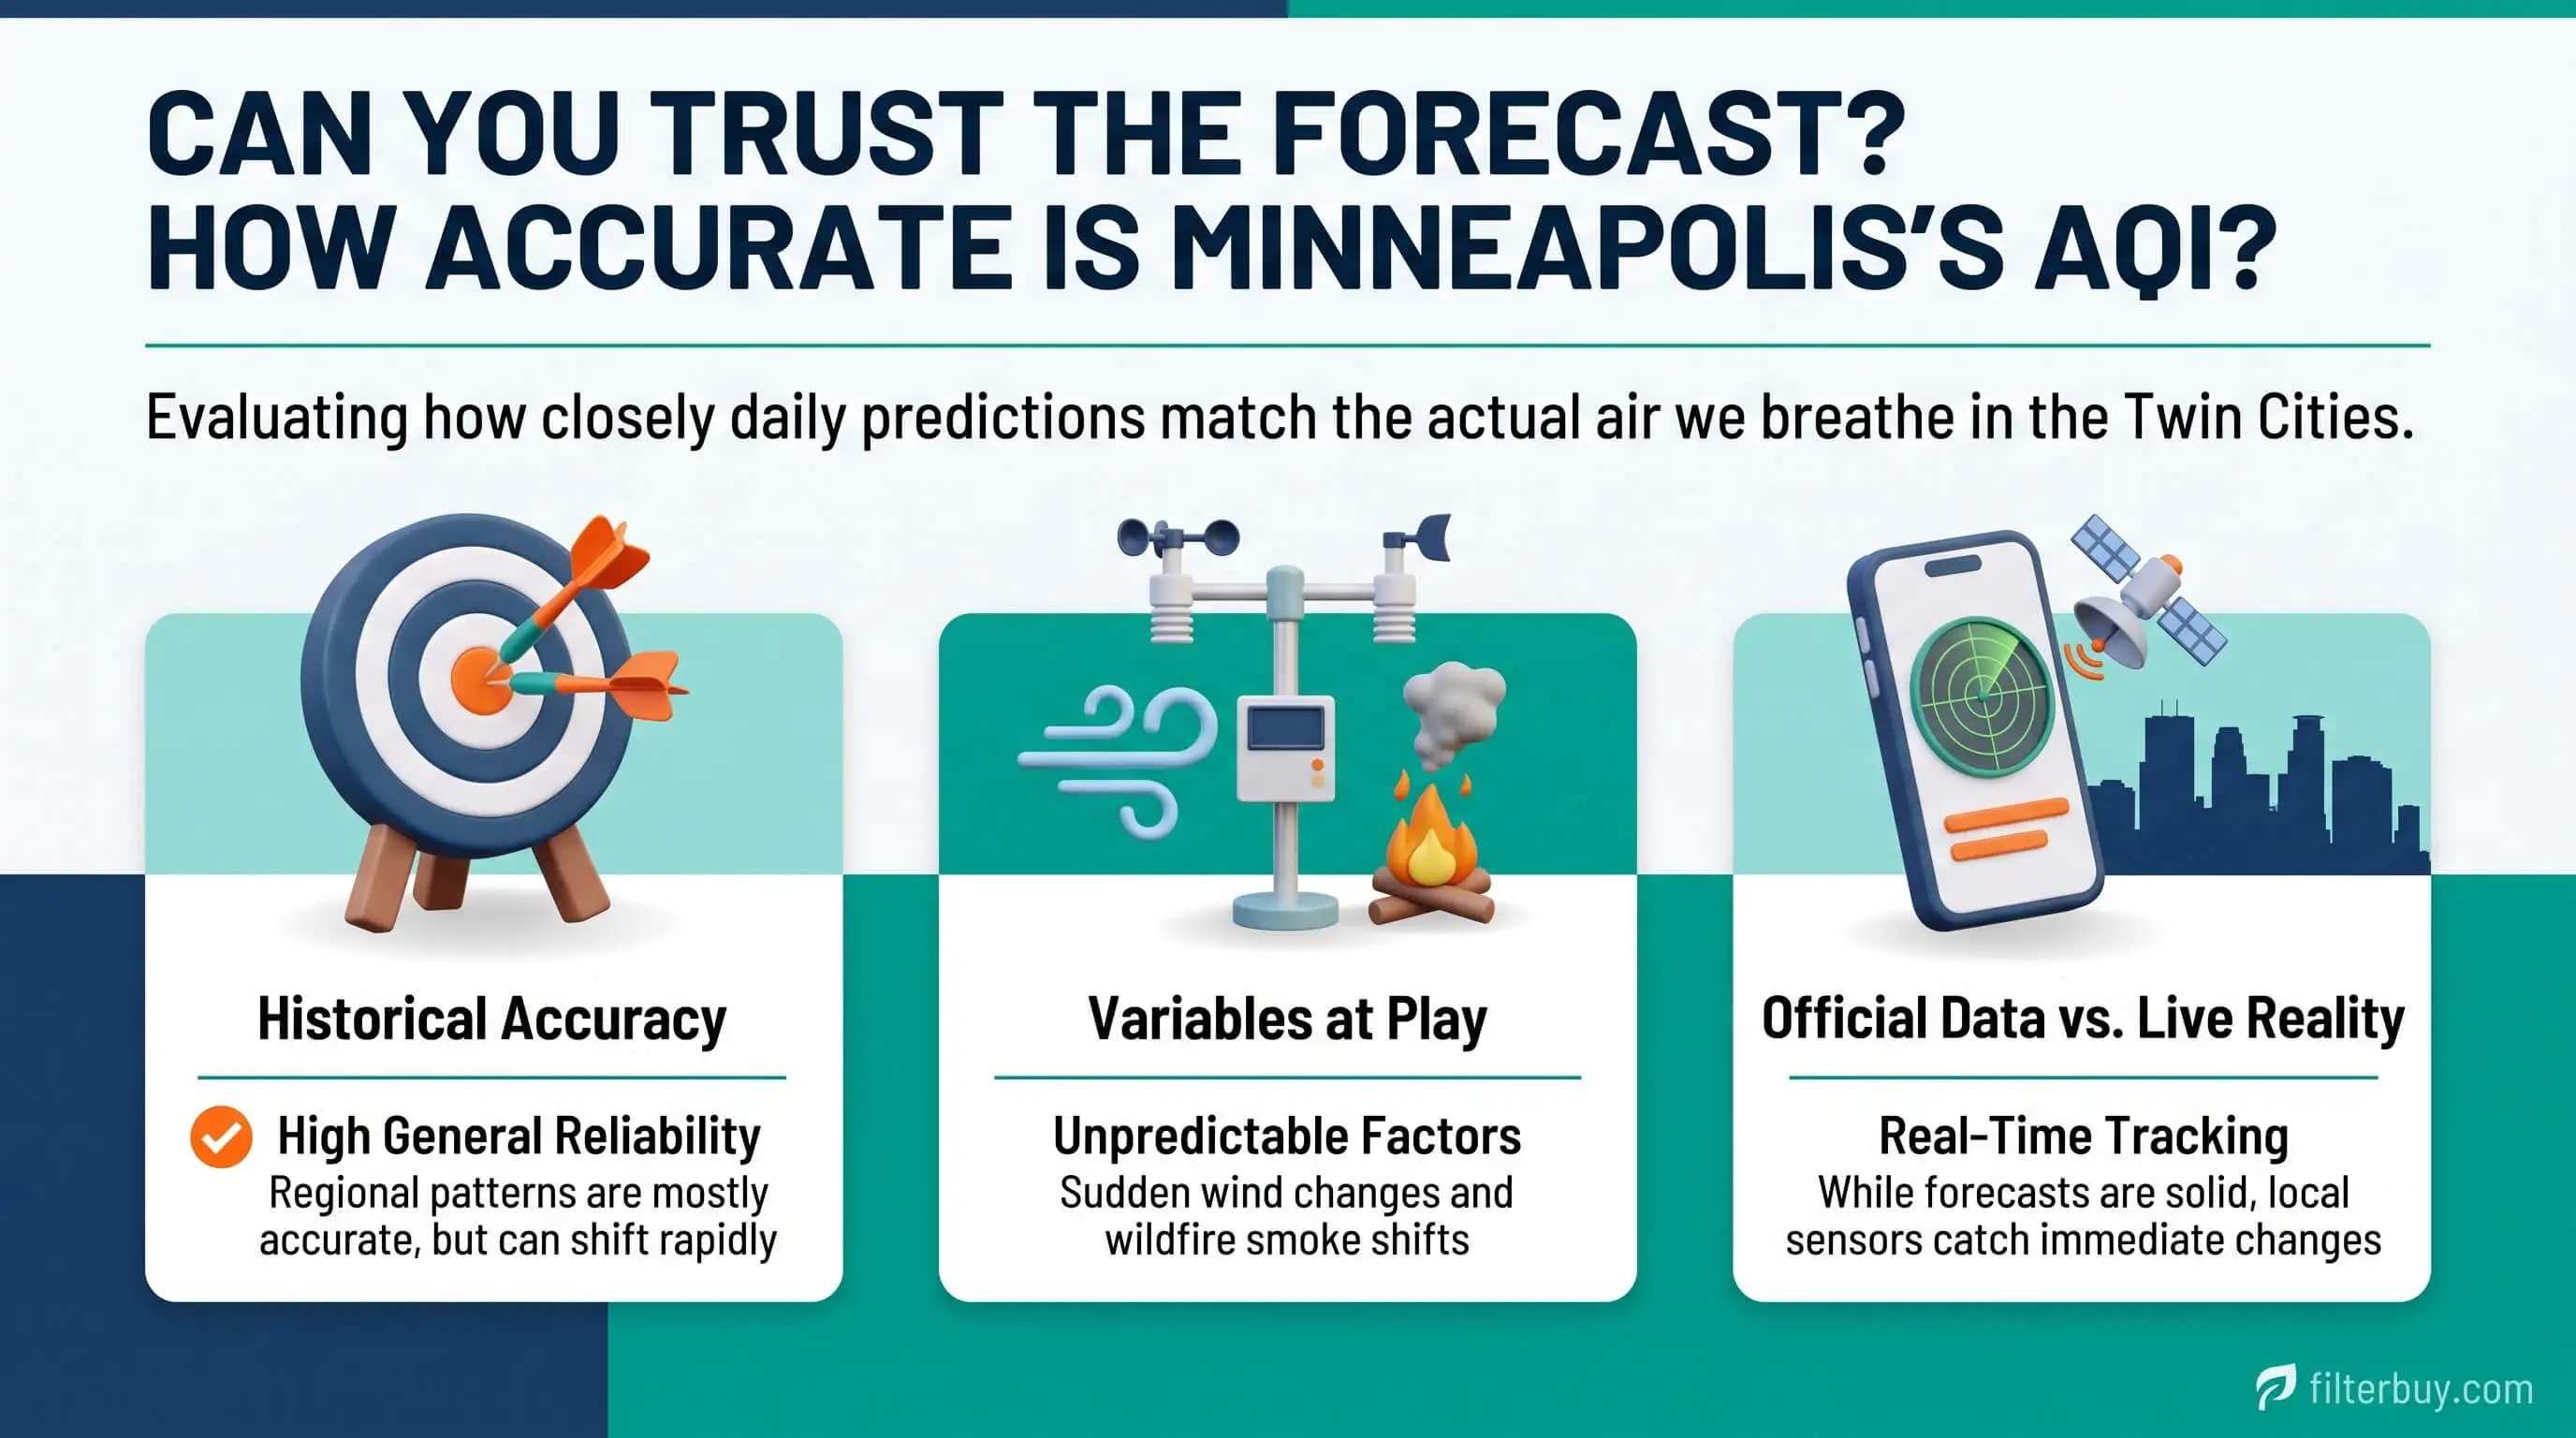
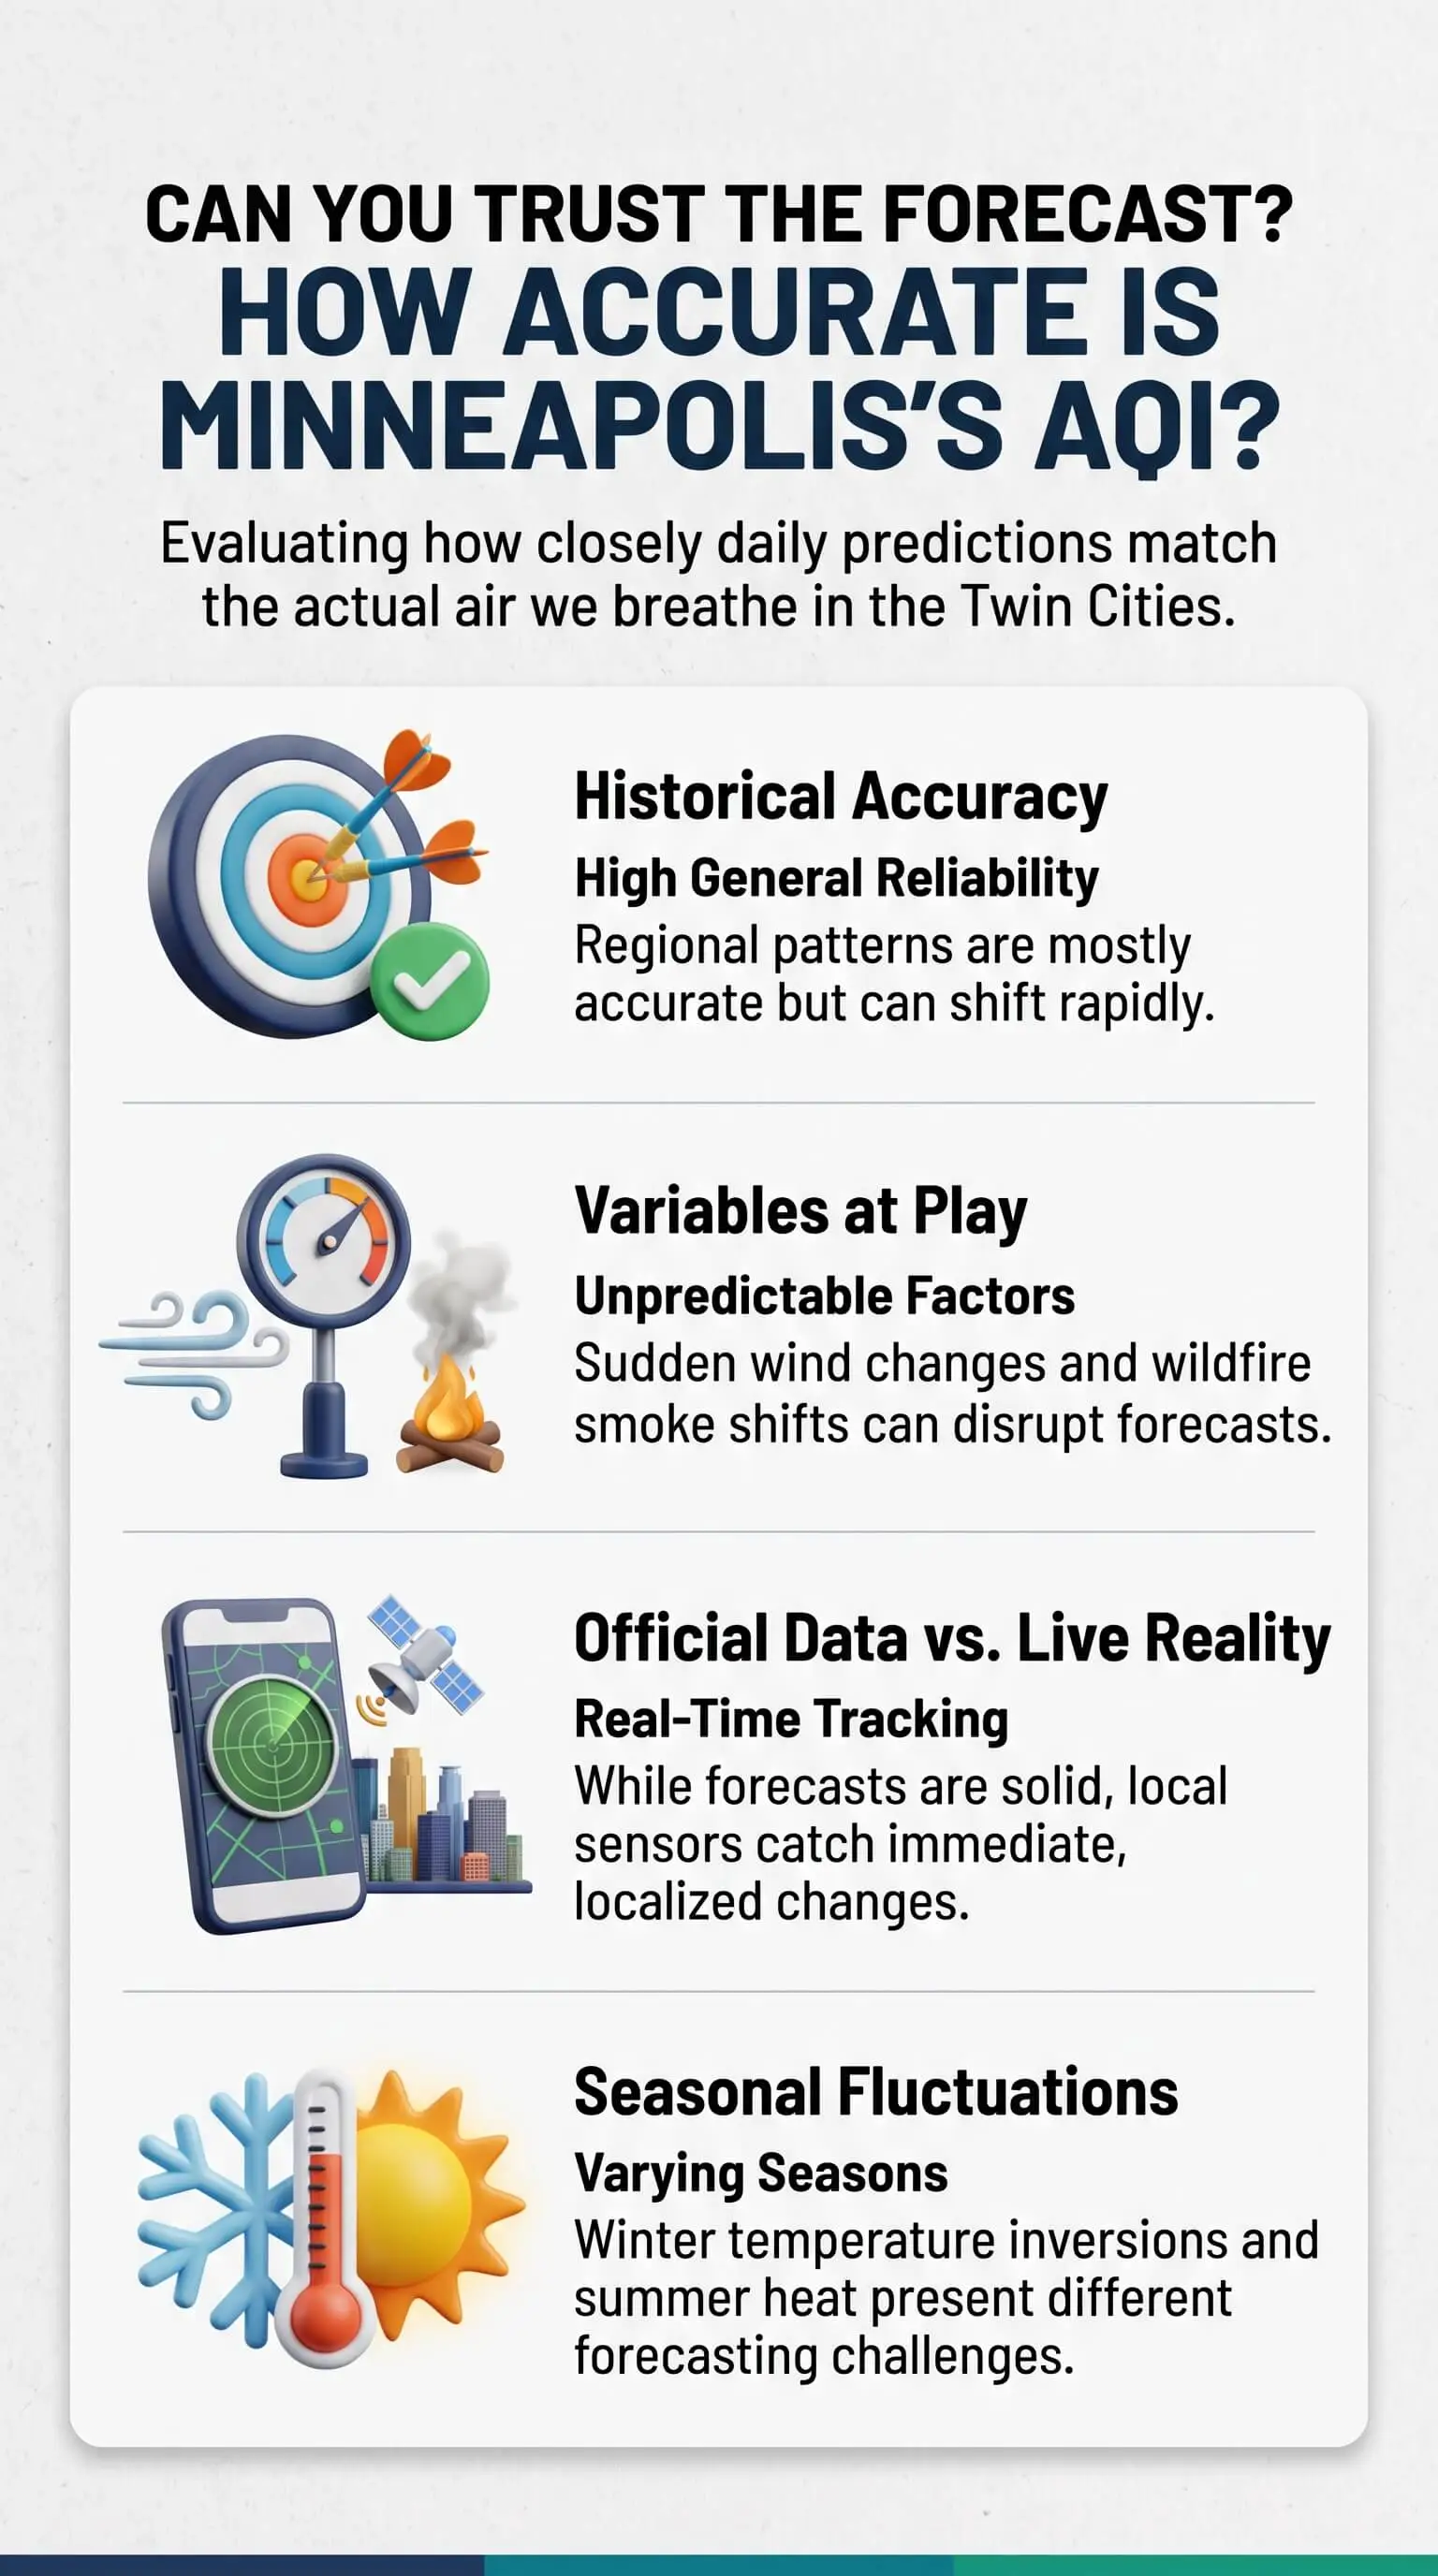
Forecasters nationwide lean on NOAA’s HRRR-Smoke model, which estimates smoke output from the heat satellites detect at each fire. That approach comes with two blind spots. Satellites can miss a new fire for several hours, and a thick plume can hide the very fire producing it. When researchers tested the model against the 2018 Camp Fire, they found it underpredicted pollution by as much as 70% on some days.
Ozone Is More Predictable
Ground-level ozone builds when sunlight reacts with vehicle and industrial emissions on hot, still afternoons. Because it follows the weather so closely, and models track heat and wind well, ozone forecasts tend to hold up. MPCA’s 2026 outlook named the Twin Cities suburbs and southeastern Minnesota near Rochester as the highest-risk ozone areas.
Winter Inversions Hold Pollution Close
On cold, calm nights, a layer of warmer air settles over the city like a lid. It traps wood smoke and traffic exhaust near the ground, and particle readings can creep up overnight on days the forecast called ordinary.
Your Block Can Read Differently Than the Forecast Zone
Each forecast covers a broad area, and your street might not match it. Freeway corridors along I-94 and I-35W, industrial pockets, and lakeside neighborhoods can all read differently from the zone average. That’s why the city publishes neighborhood sensor data.
What July 2026 Taught Us About Forecast Limits
This spring, MPCA expected 12 to 16 days of wildfire smoke impacts statewide, roughly a repeat of 2024. Then fires near the Boundary Waters broke out in early July. By July 15 and 16, alerts had climbed to maroon, the Hazardous category, in places that had never seen it, the Twin Cities included. For a stretch, Minneapolis ranked among the most polluted major cities on Earth.
MPCA sent the alert on July 14, a day ahead of the thickest smoke, so the timing held up. Intensity was another story. A seasonal outlook can’t predict one runaway fire, and daily forecasts can only model smoke that satellites have already spotted. These days I treat a smoke forecast as a heads-up and let the live reading make the call on my afternoon. Using high quality filters at home helps reduce fine particles from wildfire smoke and keeps indoor air cleaner when outdoor air quality gets worse.
How to Use the Forecast and the Live AQI Together
One to three days out: Plan runs, yard work, and kids’ practices around the forecast.
The morning of: Check live readings before you head out. If smoke shows up in the forecast discussion, check again after lunch.
At orange (101 to 150): Kids, older adults, pregnant people, and anyone with asthma or heart disease should spend less time outside.
At red (151 and up): Everyone should ease off outdoor exertion.
Don’t take your indoor air for granted when the forecast turns orange! Fine particles slip in through gaps around doors and fresh-air intakes, and you won’t see them coming. Close the windows and shut any fresh-air intake. Then flip the thermostat fan from “Auto” to “On” and run a MERV 13 filter, or the highest rating your system can handle. Little effort, big impact. If you're unsure which filter works best with your system, an HVAC technician can help you choose the right one for better indoor air quality.
“In my years comparing next-day forecasts with hourly monitor readings across the Twin Cities, I’ve seen ozone calls land in the right color category far more often than smoke calls. A smoke forecast is only as good as the satellite’s last look at the fire. Once a plume gets thick enough to hide its source, I tell people to trust the monitor closest to home over the forecast map.”
7 Essential Resources
Live Minneapolis AQI Map: Real-time city AQI, what each color means, and how to protect your indoor air.
AirNow: AQI Basics: The official breakdown of the scale, its six categories, and the pollutants behind them.
NOAA: High-Resolution Smoke Forecasting for the 2018 Camp Fire: How HRRR-Smoke tracks plumes, and why it fell short on pollution levels later in that fire.
Minnesota DNR: Dangerous Smoke Outbreak, July 14 to 17, 2026: The state climatology account of Minnesota’s worst smoke event in at least 50 years.
National Weather Service: Air Quality Safety: How NOAA and the EPA put together the national ozone and particle forecasts.
City of Minneapolis Air Monitoring Dashboard: Neighborhood sensor readings you can filter by date and area, refreshed weekly.
CDC: How Wildfire Smoke Affects Your Body: Who faces the most risk from smoke and the early symptoms worth watching for.
When comparing Minneapolis with the City with the highest smoking rate, remember that smoking rates and air quality are different. Smoking rates show how many people use tobacco, while Minneapolis AQI measures outdoor air pollution from wildfire smoke, traffic, and other sources. A city with more smokers does not always have worse air quality. Both smoking and air pollution can affect your health, so checking AQI forecasts can help you stay safe.
3 Supporting Statistics
In 2023, MPCA issued a record 21 air quality alerts spanning 52 calendar days, and wildfire smoke particles drove 16 of them. Minnesota Pollution Control Agency
The 2026 State of the Air report ranked Minneapolis-St. Paul 39th worst in the country for short-term particle pollution, and Hennepin County averaged 4.5 unhealthy days a year. American Lung Association
On May 6, 2024, the EPA dropped the top of the PM2.5 “Good” range from 12.0 to 9.0 µg/m³, so the same particle level now shows up as a higher AQI than it used to. U.S. EPA AQI Fact Sheet
Final Thoughts and Opinion
On a clear ozone day, I’d plan tomorrow around a Minneapolis AQI forecast without a second thought. Smoke days are different. When wildfire smoke shows up in the forecast discussion, I read it as a warning that the actual number could land higher or arrive sooner, and July 2026 proved exactly that. That’s why I call the forecast a strong planning tool and a weak final answer once smoke is involved.
The air you control most sits inside your home anyway. Closed windows, a running fan, and a filter built for fine particles turn a bad air day into a manageable one, and that’s where you get to be the hero of your household. Adding UV light installation to your HVAC system can also help reduce certain airborne germs, providing another layer of indoor air protection.
Frequently Asked Questions
How Far Ahead Does MPCA Forecast Air Quality in Minneapolis?
MPCA looks three days ahead and refreshes its forecast every day. Instead of chasing an exact number, the forecast focuses on the AQI color category. When orange or worse is coming, the agency aims to send an alert 12 to 24 hours before conditions arrive.
Why Does My Weather App Show a Different AQI Than AirNow?
Each source averages data differently. AirNow’s NowCast gives the most weight to recent hours, while some apps report one-hour readings or pull from uncorrected neighborhood sensors. On a steady day you’ll barely notice. When smoke moves in, the numbers can split for hours.
Is the AQI Forecast Less Accurate During Wildfire Smoke?
Yes. Smoke models count on satellites spotting each fire, and that detection can lag by hours or get blocked by a thick plume. Arrival timing tends to be easier to predict than how bad the smoke gets, so check live readings any time smoke appears in the forecast.
What Time of Day Is Ozone Worst in the Twin Cities?
Ozone usually peaks in the mid to late afternoon on hot, sunny, still days, with the suburbs and areas downwind of the metro seeing the highest levels. On an ozone alert day, early morning is typically your best window for a run.
Does the Forecast Cover My Specific Minneapolis Neighborhood?
Not exactly. Each forecast covers a broad zone, and a freeway corridor or industrial area can read higher than the zone average. For a closer look at your block, pair the forecast with a live AQI map and the city’s neighborhood sensor dashboard.
How Do I Get Minneapolis Air Quality Alerts on My Phone?
Start by signing up for MPCA’s email alerts. The National Weather Service also carries MPCA alerts, so they pop up in many weather apps right next to storm warnings. For current readings and forecasts by ZIP code, add the AirNow app.
Plan With the Forecast, Decide With the Live AQI
The AQI forecast for Minneapolis gives you a solid head start most days, and the live reading tells you what to do once smoke fills the air. Lean on both, keep your indoor air protected, and you’ll be ready whenever the next alert lands.